Hello and welcome,
Machine learning problems are about learning from the data to predict the "Behaviour" of unknown data or upcoming data. The digits example is a classic and it's like a hello world! in ML.
Table of Contents
 |
| Handwritten Digit Recognition |
In this blog, we are going to solve this problem from scratch by installing all the tools, understanding the code, and using a very well-known library called scikit-learn. Let's get started.
You can use Jupyter Notebook or Google Colab for developing the project. I will use Goggle Colab and will make the notebook available for you in case any doubt arises.
Project Overview
There are some scanned images(handwritten digits) in the dataset and for each digit, we know the label(digit) it represents. for instance, there's an image, we know it's representing number 7. the problem statement is to make the ML model capable to learn from all images and predict the correct outcome on unseen images or digits.
Dataset Overview
Sklearn has some built-in datasets that allow you to start quickly without downloading any external datasets. If you want to download any external dataset of digits you can. I am going to use a popular Sklearn dataset known as the MNIST dataset.
from sklearn.datasets import fetch_openml
#load dataset as
mnist = fetch_openml('mnist_784')
Now, to see the data and target variable use the following code.
print(mnist.data.shape)
print(mnist.target.shape)
when you will run both statements, you will see that the data consist of 70000 rows and 70000 labels. Now what we will do is take the data and target features in different variables to have a cleaned analysis.
x, y = mnist['data'], mnist['target']
when you will run or try to see the x, what are you seeing in that output? it is a one-dimensional data or array. so, the dataset contains the images in form of pixels in which rows are stacked to form a digit in form of an array. so, the dataset consists of 28 by 28 grayscale images.
GrayScale Image: Grayscale image is simply one in which the only colors are a shade of gray(composed exclusively of shades of gray). The reason for differentiating such images from any sort of color image is that less information needs to be provided for each pixel.
Sample digit into an image
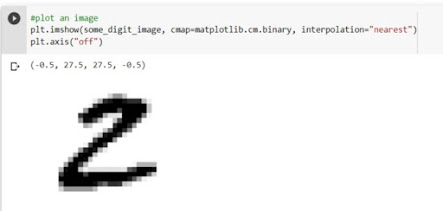
To see this array in form of an image we need to reshape it into 28*28. for plotting the image we will be using a popular visualization library known as Matplotlib.
import matplotlib
import matplotlib.pyplot as plt
I will show an example of 1 label by plotting, you can try with a different label too.
some_digit = x[161]
some_digit_image = some_digit.reshape(28,28)

#Plot an image
plt.imshow(some_digit_image, cmap=matplotlib.cm.binary, interpolation="nearest")
plt.axis("off")
 |
| Digit to Image Visualization |
Splitting Dataset into Training and Testing Set
x_train, x_test = x[: 60000], x[60000 :]
y_train, y_test = y[: 60000], y[60000 :]
import numpy as np
shuffle_index = np.random.permutation(60000)
x_train, y_train = x_train[shuffle_index], y_train[shuffle_index]
 |
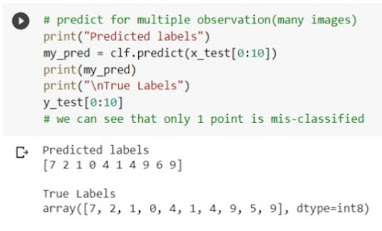
| Plotting Digits with labels |
Building a 2- Detector
y_train = y_train.astype(np.int8)
y_test = y_test.astype(np.int8)
y_train_2 = (y_train == 2)
y_test_2 = (y_test == 2)
from sklearn.linear_model import LogisticRegression
log_clf = LogisticRegression()

#Now train it.
log_clf.fit(x_train, y_train_2)

#Test it, on the sample digit we have plotted early because we know it's a label.
log_clf.predict([some_digit])
from sklearn.model_selection import cross_val_score
cross_val_score(log_clf, x_train, y_train_2, scoring="accuracy")
clf = LogicticRegression(solver="lbfgs")
clf.fit(x_train, y_train)

#Now, you can predict it on new data(new images)
clf.predict(x_test[0].reshape(-1, 1)

#check the label, is it correct to not
y_test[0]
Measuring Model Performance
score = clf.score(x_test, y_test)
print(f"accuracy_score: {score}")
The score is nice, we got an accuracy score of approximately 92 percent.
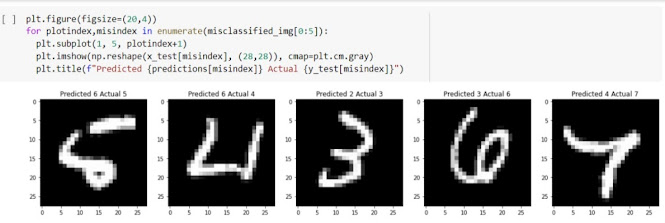
Displaying the Misclassified Images with Predicted labels
index = 0
misclassified_img = []
for label, predict in zip(y_test, predictions):
    if label != predict:
        misclassified_img.append(index)
    index += 1
Plot the graph of misclassified images
CONCLUSION
I hope, you enjoyed the project here, The important thing is making a Machine learning model in Sklearn is not a lot of work. The main thing is to get the concepts that are running behind it. I hope that the blog is helpful for you to find the best from this and whatever your motive for the project is.


Keep the
ReplyDeleteGood
Work up...
Very nice detail explanation of each step. I like your colab notebook and code.
ReplyDeleteThank You.
DeleteGood work
ReplyDeleteGood work 👍😁
ReplyDeleteThank u for such valueable content ..
ReplyDelete